Research
The resource settings behind 66 Terminal-Bench tasks
Terminal-Bench v4.1.0 declares different resource settings across its 66 tasks. In a census of their configuration files, 31 tasks specify more than 4,096 MB of memory and 22 specify more than two CPUs. A comparison preset built from the most common explicit CPU, memory, storage and GPU values falls below at least one declaration in 38 tasks. These differences identify settings an evaluation team should preserve or document when configuring its sandboxes; they do not predict resource consumption or task failures.
The practical question is straightforward: when you run the same benchmark in a new environment, which conditions are you carrying over? The task version, runner version, overrides and backend policy all contribute to the answer.
The release contains several resource scales
We inspected every task in the official Terminal-Bench v4.1.0 manifest, released on 3 November 2026. The population is 66 release members, each with a task.toml file at a pinned source commit. The repository also contains legacy tasks and testing fixtures; those are outside this census. Official release and manifest
The top-level environment declarations span 2 to 16 CPUs and 4,096 to 32,768 MB of memory. The most common CPU value is two, appearing in 44 tasks. The most common memory value is 4,096 MB, appearing in 35. The rest of the release is distributed across larger declarations.
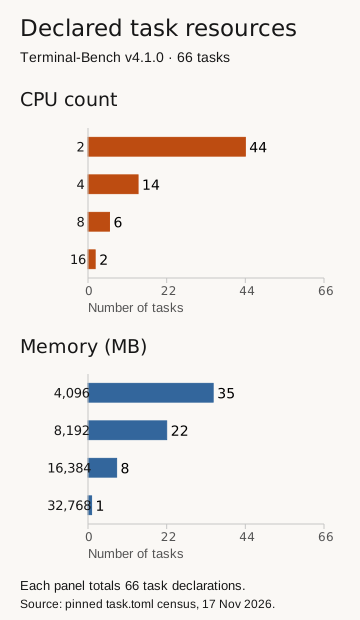
Each panel covers the same 66 task environments. Values are declarations in the release's configuration files. The complete observations include a pinned URL and source hash for each task.
This matters when a team standardizes its infrastructure. A uniform environment can simplify scheduling, but it changes some declared conditions unless the runner applies task-specific settings within it. More available hardware also does not automatically preserve a smaller declared limit. The correct comparison depends on what the runner and backend enforce.
A preset assembled from common values changes many declarations
To make that comparison concrete, we constructed a preset using the most frequent explicit value in each of four fields:
| Field | Constructed comparison value |
|---|---|
| CPUs | 2 |
| Memory | 4,096 MB |
| Storage | 10,240 MB |
| GPUs | 0 |
This is our analytical comparison, not a Harbor default, vendor recommendation or observed deployment. Each value is individually common; their combination is not assumed to be the most common complete configuration.
For each task, we checked whether any explicitly declared value exceeded the corresponding comparison value. The result is 38 of 66 tasks. The per-field counts are 22 for CPU, 31 for memory, 17 for storage and three for GPU count. These groups overlap, so adding them would overcount tasks. The comparison results contain the exact task list for the union and for each field.
The remaining 28 tasks are simply not above those four comparison values in the recorded declarations. That result does not establish that the preset is compatible with them. Eight tasks omit GPU count, and the comparison does not turn omission into a declared zero. Files, sidecars, images and services can also introduce requirements outside these four fields.
For runs without a GPU, the maintainers provide a separate 63-task CPU-only dataset in Terminal-Bench 4.1.0. Run it with harbor run -d terminal-bench/terminal-bench-cpu-only@4.1.0, and identify results from that dataset separately from scores for the full 66-task release. CPU-only does not establish that every task fits a particular CPU, memory or storage ceiling.
Use the exception list to inspect the settings a standardized setup would change. It can guide configuration review before a run.
A declaration passes through the runner and backend
A task file is one part of the evaluation setup. We reviewed Harbor source at a fixed commit whose package metadata identifies version 0.26.0 to understand how these declarations are consumed.
In that source, trial-level resource overrides can replace task values. CPU and memory policies can also change whether values are applied or ignored. The parser leaves omitted CPU, memory and storage values nullable; the base environment maps an omitted GPU count to effective zero. The census keeps the original omission visible so a reader can distinguish an authored setting from the runner's interpretation. Pinned Harbor environment logic
Backend behavior creates another distinction. The reviewed Docker adapter maps its automatic CPU and memory policies to limits. It explicitly ignores GPU-type selection, and its Compose resource writer does not write a storage cap. Three release tasks explicitly name an H100, but that field alone does not establish that the Docker run receives one. Likewise, a storage_mb value alone does not establish a Docker disk limit. Existing Compose configuration may add constraints; other backends have their own behavior. Docker adapter, Compose resource writer
For a reproducible evaluation, preserve the declaration and record what the chosen backend actually did with it. A log of the requested setting and a log of the resulting allocation answer different questions.
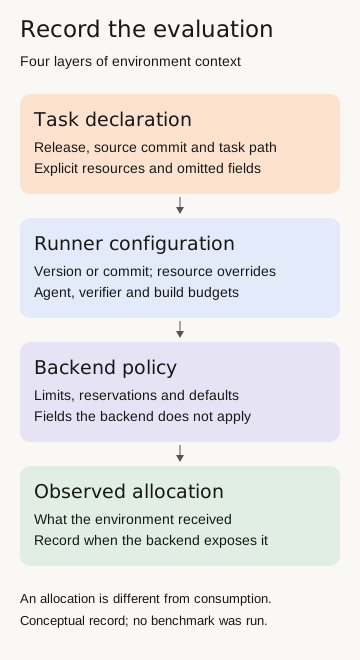
Keep requested settings and observed allocations in separate fields.
Agent timeouts and verifier settings need their own record
All 66 task files explicitly set the agent timeout to 28,800 seconds, or eight hours. That is a configured ceiling, not an observed duration. Verifier timeout declarations range from 60 to 18,000 seconds, and build timeouts range from 300 to 18,000 seconds. These phases therefore should not be collapsed into a single “task time” estimate.
The reviewed runner can apply timeout overrides, maximums and multipliers. Its resolution order matters: a maximum is applied before the multiplier in the inspected function. The analysis does not add phase ceilings together to predict total wall-clock time. Pinned timeout resolution, phase-budget computation
Every task also explicitly selects separate verification. Six provide a verifier-environment block. In the inspected Harbor resolver, an explicit verifier environment is selected as a whole; it is not merged field by field with the task environment. Without a separate block, the resolver copies the task environment. Trial overrides can still affect the resulting verifier setup. Verifier configuration resolver
The operational implication is to record agent and verifier settings separately, even when they happen to agree. “Separate verification” by itself does not state the effective resource allocation or imply two environments consuming resources concurrently.
Between Terminal-Bench 4.0 and 4.1, we compared selected CPU, memory, storage, GPU, timeout and verifier-mode declarations for the 66 tasks with matching names and paths. The comparison found two tasks with changes in those fields: distributed-dedup raised its verifier timeout from 1,800 to 3,900 seconds, while the explicit verifier declarations for payments-pipeline-fix rose from 6 CPUs and 12,288 MB to 8 CPUs and 16,384 MB. These are declarations, not measured allocations. The 4.1 release says all 66 tasks were modified; this narrow check does not establish that their instructions, images or verifiers are equivalent.
Download compare-versions.py and census.json into the same folder. With Python 3.11 or newer and network access, run python3 compare-versions.py > comparison.json from that folder. The script fetches the pinned 4.0 registry and task metadata without executing tasks. The local report retains the upstream attribution and its request to keep benchmark data out of training corpora.
What to preserve when changing an evaluation setup
The census supports a compact configuration record:
- Pin the task set. Keep the release manifest, source commit and task paths together. A repository-wide file count can include material outside the benchmark release.
- Retain the original declarations. Record explicit values and omissions, including separate verifier settings and phase timeouts.
- Record the runner and overrides. Keep the exact version or commit and the options that replace or scale task settings.
- Check the backend policy. Identify which fields become limits, reservations, defaults or unsupported requests in that backend.
- Record the resulting allocation when observable. Keep this separate from the requested configuration and from measured consumption during the run.
If you intentionally change a limit or allocation, document the change alongside the result. That gives a future reader enough information to understand the conditions of the evaluation without treating every environment as interchangeable.
The configuration comparison and analysis code make the exceptions inspectable. Sapien1's agent evaluation work applies this kind of task and environment review when scoping an evaluation project.
To compare other ceilings, download the resource filter and the census into the same folder. For example, python3 filter-census.py --cpus 4 --memory-mb 8192 --status within lists declarations within those limits for both the task and verifier. The output preserves omissions and does not establish whether a task will run. Terminal-Bench asks that benchmark data stay out of training corpora.
Methods and scope
This is a complete census of one release's configuration declarations, collected on 17 November 2026. It is not a sample of all agent benchmarks or a performance experiment. The dataset source is Terminal-Bench commit 4070d6c; the inspected runner source is Harbor commit ec6aeab, identified as 0.26.0 in its project metadata. Full hashes, source links, extraction rules and reproduction commands are in the methods.
The collector reads the official manifest and 66 TOML files, totaling 85,966 source bytes. It preserves version fields separately and checks for legacy resource aliases, steps and additional environment blocks. It found no steps or legacy resource aliases in this release. Public downloads contain selected configuration facts and source hashes, rather than task instructions, solutions or full environments.
We independently checked manifest membership, calculations and source samples covering an outlier, an omitted GPU field and an explicit verifier block. No model, container or benchmark task was run.